
A marketing report is an essential document for all marketers. It shows where your company’s digital marketing strategy is at and how it can be improved. It also lets you showcase the marketing department’s successes and demonstrate the value of your work.
But just what information should it include and how often should you be reporting? Until recently, creating a marketing report probably meant opening a lot of Excel files and many hours of work to produce something that your CEO found difficult to read. Now, with the right tools and a solid reporting process, marketing reporting can help take your business to the next level.
To help you create a marketing report quickly and easily, we’ve created a marketing report template that you can download. And in this post, we’ll go over the marketing reporting process and how you can use it to guide future marketing actions.
In this post, we’ll look at:
- How to do marketing reporting the right way
- How often to report
- Marketing reporting tools
- How to create a B2B marketing report
- How to save time in the reporting process by using marketing automation
1. How to do marketing reporting the right way
1.1. Answer a twofold objective
Create a comprehensive marketing report that is of benefit to both you and your audience.
- For you: it measures your performance and therefore can help identify ways to improve this. Marketing reporting also lets you suggest new marketing ideas or campaigns to your executive team based on your results, thereby helping your business to grow.
- For your executive team: In the short term, it provides proof of the return on investment of your work, and lets your audience take advantage of your recommendations. In the long term, marketing reporting also gives your CEO a clear overview of objectives and results, enabling them to make decisions that are financially sound.
However, you should ensure that the report doesn’t just summarize the various results achieved. It also needs to explain the how and why of your performance. Your executive team must be able to clearly understand how these results were achieved.
 1.2. Adapt the report content to your audience
Analysing figures isn’t necessarily an easy task at the best of times. So, the metrics that you include in your report and the way you present these both need to be adapted to what your audience is expecting to see.
A CEO won’t place as much emphasis on click rates, visitor numbers to your blog, or Cost per Lead (CPL) as you might, for example. If you are presenting your marketing report to them, you need to have the best data possible for final results, customers, and the ROI of the marketing department.
1.3. Be clear and concise
Regardless of what information that you include in your report, it will be easier to read if you stick to the format of 1 slide for each idea.
You should also avoid including every KPI possible. Instead, focus on those things that are the most meaningful, including:
- the verifiable results obtained;
- your views on the reasons for these results;
- your recommendations for future marketing campaigns and the company’s overall strategy.
Above all, it’s important to present figures which will enable your company to take actionable steps and avoid including vanity metrics at all costs.
2. How often to report
If you’re reading this post, it probably means that you understand the importance of tracking your performance and its progress over time. But how often should you report?
How often you produce a marketing report depends on your strategic objectives. There are different advantages to reporting at different times.
- Weekly: a weekly report for tracking results, and/or for a specific channel
- Monthly: this report presents the preceding month’s figures and performance and identifies areas for improvement in the coming month. This can be either for your own benefit or that of your executive team.
- Quarterly: three months is an ideal period to provide an in-depth analysis of your marketing strategy and a chance to re-examine this if necessary. The same also applies to a half-yearly or annual report.
Specified period: it’s also possible to produce a report for a specific campaign (e.g. product launch, special offer). In it, you should only consider the channels and objectives specific to this campaign. This can either involve a very short or very long period of time.
3. Marketing reporting tools
In the remainder of this post, we’ll look at each slide of the marketing report that we use at Plezi, and which you can download a template for.
To create one for yourself, you will need:
- a presentation tool: PowerPoint, Keynote, or Google Slides;
- a tool for making screenshots;
- a marketing automation tool and a CRM to have an overview of your leads and conversion funnel;
- the analyses of your various marketing channels (e.g. social media, advertising agencies, email marketing tools, Google Analytics, Google Search Console).
If you have the right tools, you should be able to use our template to quickly create your own marketing report. This will let you spend more time on preparing the action plan based on your results.
Of course, you need to decide on what KPIs to include based on what works best for your company. The elements that we’ve included in the template are based on our experience, not on any theory about how a marketing report should be prepared.
The length of the report will vary as a result, because it’s up to you to choose the relevant slides from the template based on your current marketing strategy. For example, if you use an inbound marketing strategy exclusively and don’t use advertising, just delete this section in the template.
4. How to create a B2B marketing report
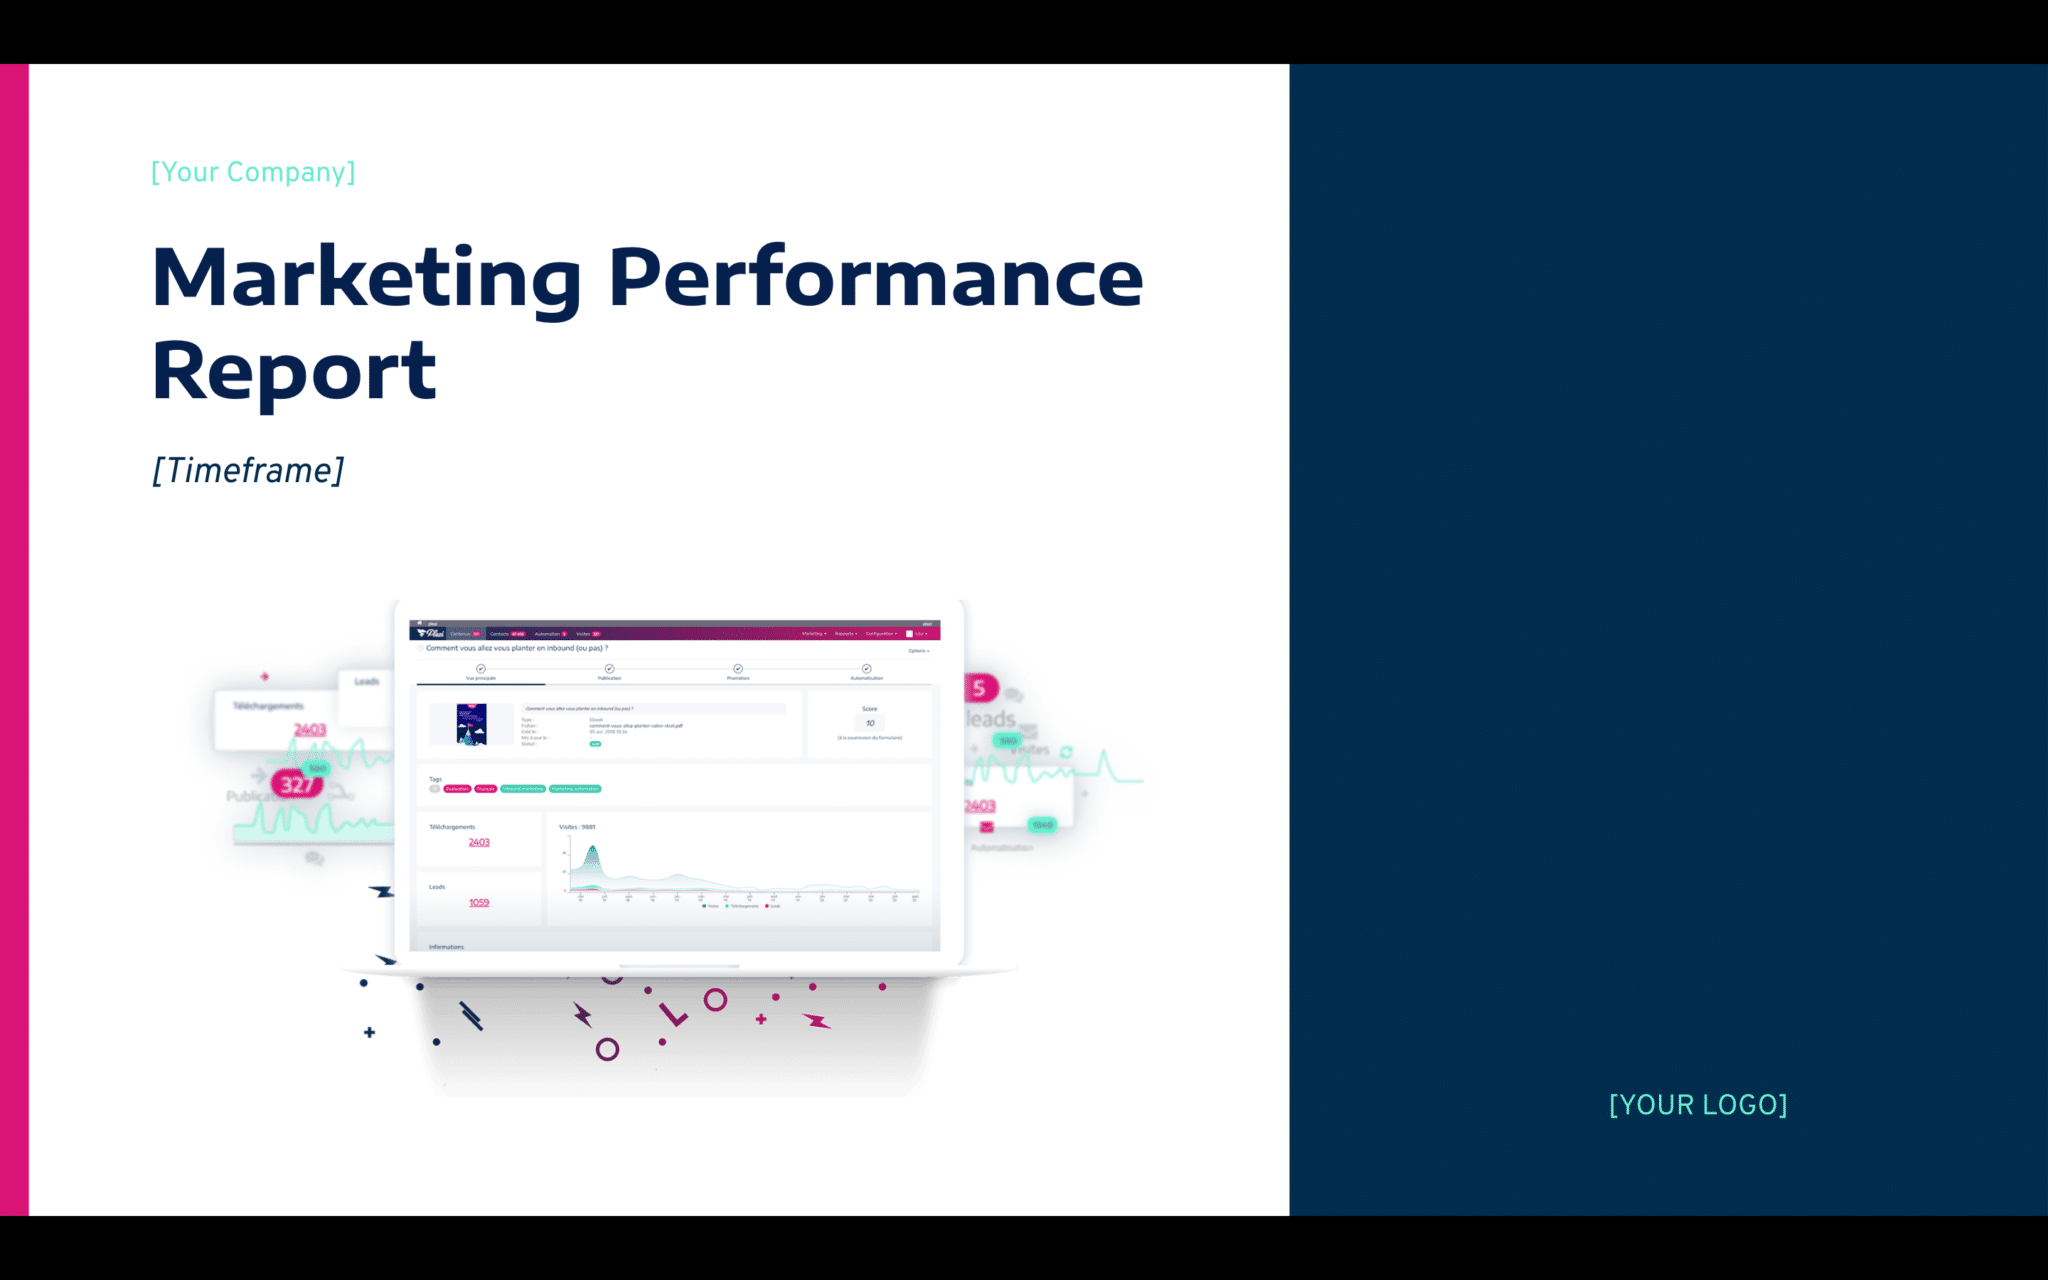
It’s a good idea to use an appealing visual image here. Having an introductory slide that reflects your brand will enhance the look of your report.
Be sure to include:
- the logo of your company;
- the title and purpose of the report;
- the period covered by the report
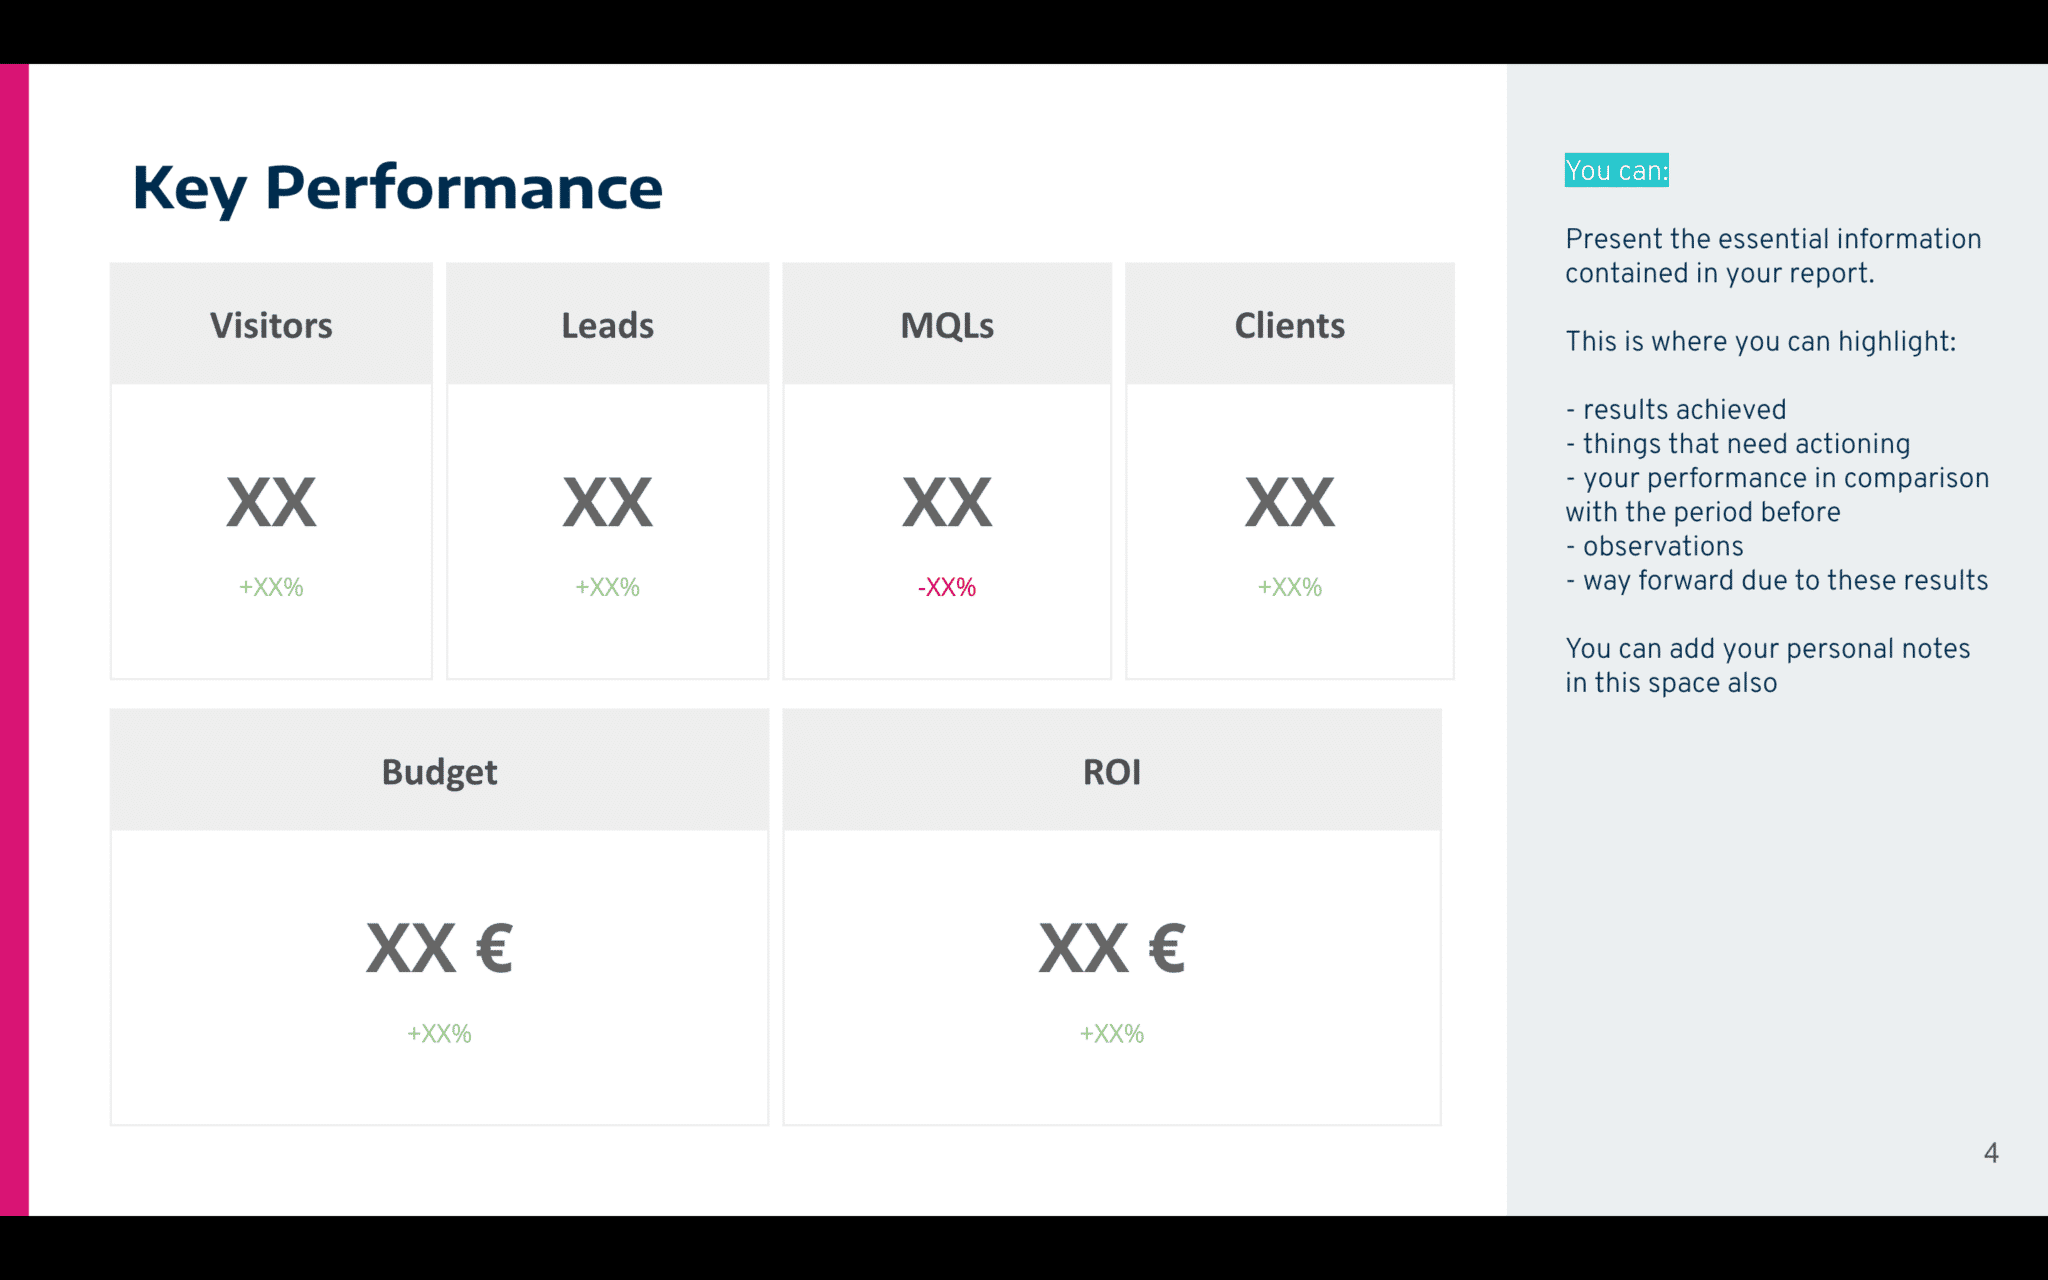
4.2. Summary of results and KPIs
What does your audience need to know about the period under review?
Often called an “executive summary“, this introduces the most important information contained in the marketing report. In practical terms, this slide tells your executive team and other key stakeholders where your business is currently at and where it is going, hence its critical importance.
This is the ideal place to highlight:
- results achieved
- the ROI of marketing actions;
- things that require further action;
- changes in your performance;
- observations critical to your audience;
- the action plan drawn from this report.
At Plezi, we use this slide to provide a comprehensive overview of the conversion funnel, including tracking of visitors, leads, MQLs, and new customers.
4.3. Sales & Marketing Performance
What information do you have about leads generated during this period?
What results have you seen from leads passed to the sales team? This series of slides look at the source of leads and their progress in the conversion funnel. It is divided into three parts: conversion rates, source, and quality of leads.
Lead conversion rates
This slide should highlight the KPIs that measure lead generation and their progress in the conversion funnel.
To give you an example, at Plezi we track the journey of leads using 6 stages:
- Conversions (number of downloads)
- Leads (a newly converted lead not already in our contact database)
- MQLs: leads that reach a score of 40 in Plezi
- Appointment 0: first successful qualifying sales call
- Appointment 1: software demonstration call
- Customer (and customer lifetime value)
This is an evolving process that took a long time to initially set up, so this slide lets us better visualize this journey and then optimize it. This is what works for us, but again, you’re free to adapt the slides and the content contained in the template.
Source of leads
Knowing where leads have come from is vitally important for any business. The first step is to understand which channels perform the best at generating leads and converting them. This lets you identify differences in how these channels have performed. You then need to decide on which channels you should put more or less effort into developing and distinguish them from those to set aside or which need to be optimized.
Quality of leads
To get a better idea of the quality of leads passed to salespeople, you need to analyse the number of leads that are closed or rejected and the reasons for these.
To be able to get this information, it’s important that there is good communication between the sales and marketing teams. We also recommend integrating your marketing automation platform with your CRM. If you want to understand why leads were closed but your CRM doesn’t give you access to these figures, having a conversation with your sales team is probably a good place to start.
You can see this article that goes into how we integrated our marketing process with Salesforce to get a more detailed idea.
4.4. Website and content performance
How has your website and content performed?
Your website is now like the front door to your business. You need to know who walks through it, leaves soon after they enter, or stays to have a good look around.
That’s why you need to include at least some basic information about the performance of your website and content in your marketing report. This could include an analysis of your website traffic, SEO, blog, premium content, and webinars. This will give your executive team a good overview of how your internet presence has developed in the period under review.
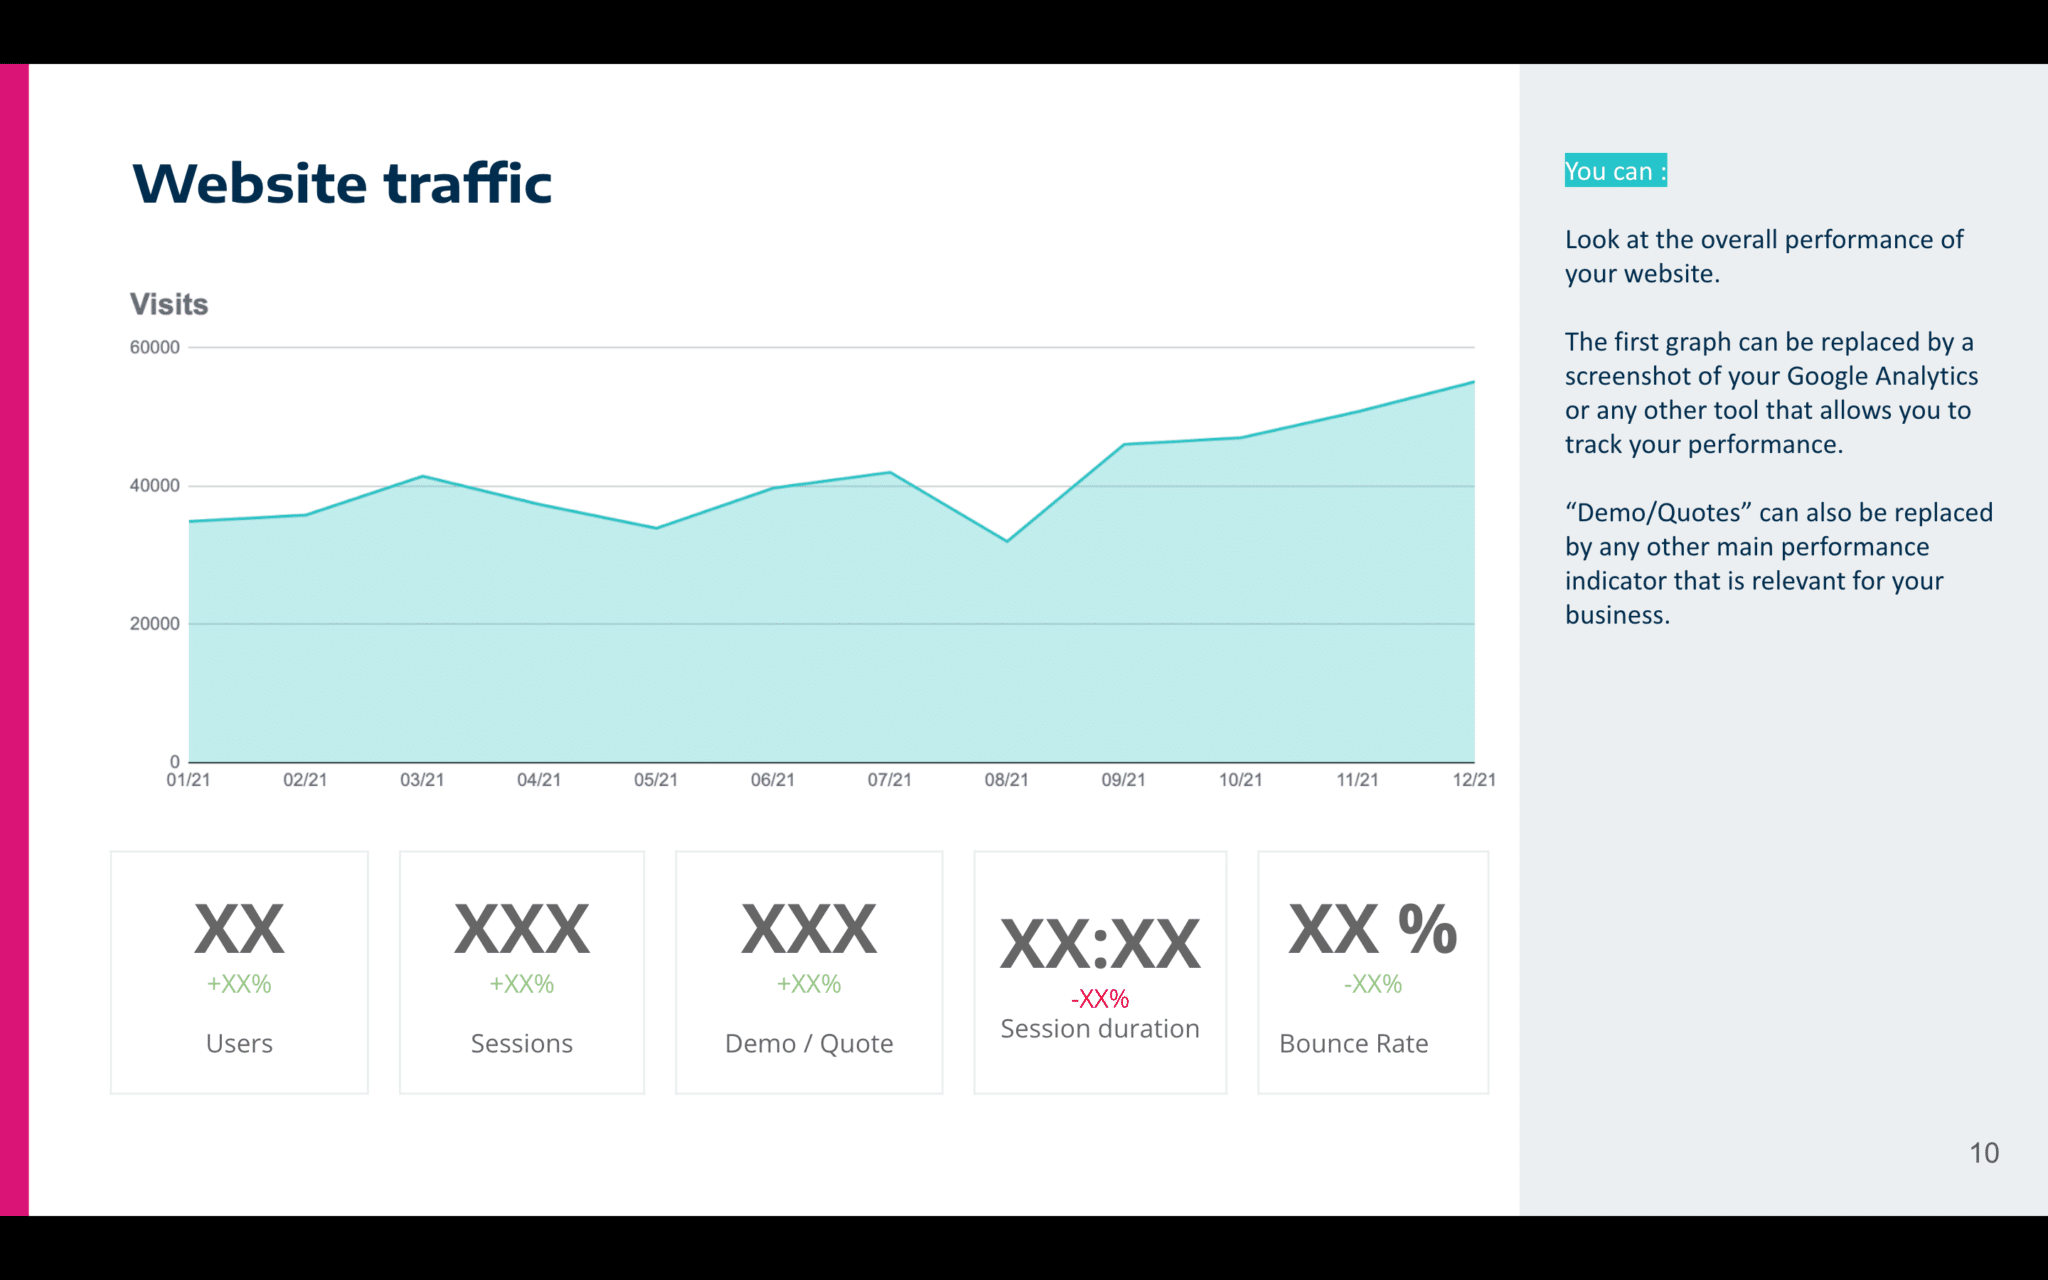
Website traffic
How much traffic was generated over the current period? What is the change compared to the previous period?
A screenshot of the graph that shows website traffic is very useful for identifying both good news and bad news. On the one hand, it will help you to identify peaks in website traffic, with the aim of understanding what caused these.
It will also help identify any red flags, e.g. a bounce rate that’s too high, or shorter session times.
Organic Search
There are some important SEO KPIs that you must include when creating your marketing report. These will give you information about how visible your website is online and can be found in Google Search Console. If you’d like to know more about this subject, we’ve put together a guide to using Google Search Console.
The purpose of this slide is to show how well your website ranks in search engines. This is a good way to find out if the content you create ranks for certain new keywords and if the meta titles and meta descriptions of your blog posts are written in a way that will generate traffic.
Blog performance
If you have a blog, how many people read it or sign up to receive new blog posts? A blog is a strategic tool for any B2B company. So it’s essential that you monitor the role your blog plays in increasing turnover.
By adding calls to action, to optimize your site conversion, that links to premium content, your blog can also be one of the principal ways in which you convert visitors into leads.
So you need to measure its performance in terms of both visibility and conversions and identify the most viewed posts.
Performance of premium content
Premium content is content that is offered to visitors in exchange for certain information about them. Examples of these are white papers, templates, practical kits, and checklists. They are a great source of contacts that can be added to your database, so you also need to measure how they perform.
This will let you identify the content that your audience finds most interesting, giving you some great ideas for creating content in the future on similar topics.
Webinar performance
Webinars are a great way to quickly establish a relationship with your target audience. That’s why it’s also important to measure the performance of the different webinars you produce. As with other premium content, doing so will enable you to adapt the content of future webinars to the interests of your target audience.
Here are some relevant KPIs for assessing the effectiveness of your webinars:
- number of people registered
- number of people who viewed a webinar
- number of downloads of the webinar replay
- number of leads generated
4.5. Email marketing
How effective have your email marketing campaigns been?
Email marketing is one of the most effective marketing channels available to a B2B business. It is also one that will deliver one of the best returns on investment.
But for an email marketing campaign to be successful and to achieve your campaign goals, you need to identify and monitor the appropriate KPIs.
Performance of email marketing campaigns
In this slide, you will show how your different email campaigns carried out in the current period have performed.
You can highlight the best performing campaigns for some of these KPIs, and those that have performed worst for others. This will give your executive team a better understanding of the reasons behind this performance. It will also let you replicate your successes and avoid your mistakes more easily in the future. The interest in doing so remains the same: to identify the most successful campaigns so that you can learn from them.
Tip: If you’re a Plezi user, you can replace the table in this slide with a screenshot of the “Email campaign” report to save time!
Newsletter performance
The slide that shows how your email newsletter has performed is similar to that for your email marketing campaigns. You just need to add the changes in the number of people who have signed up for your newsletter and the number of people who have unsubscribed. The difference between these two figures will give you the net number of new subscribers.
This will let you track how your newsletter performs and changes in the number of contacts in your database.
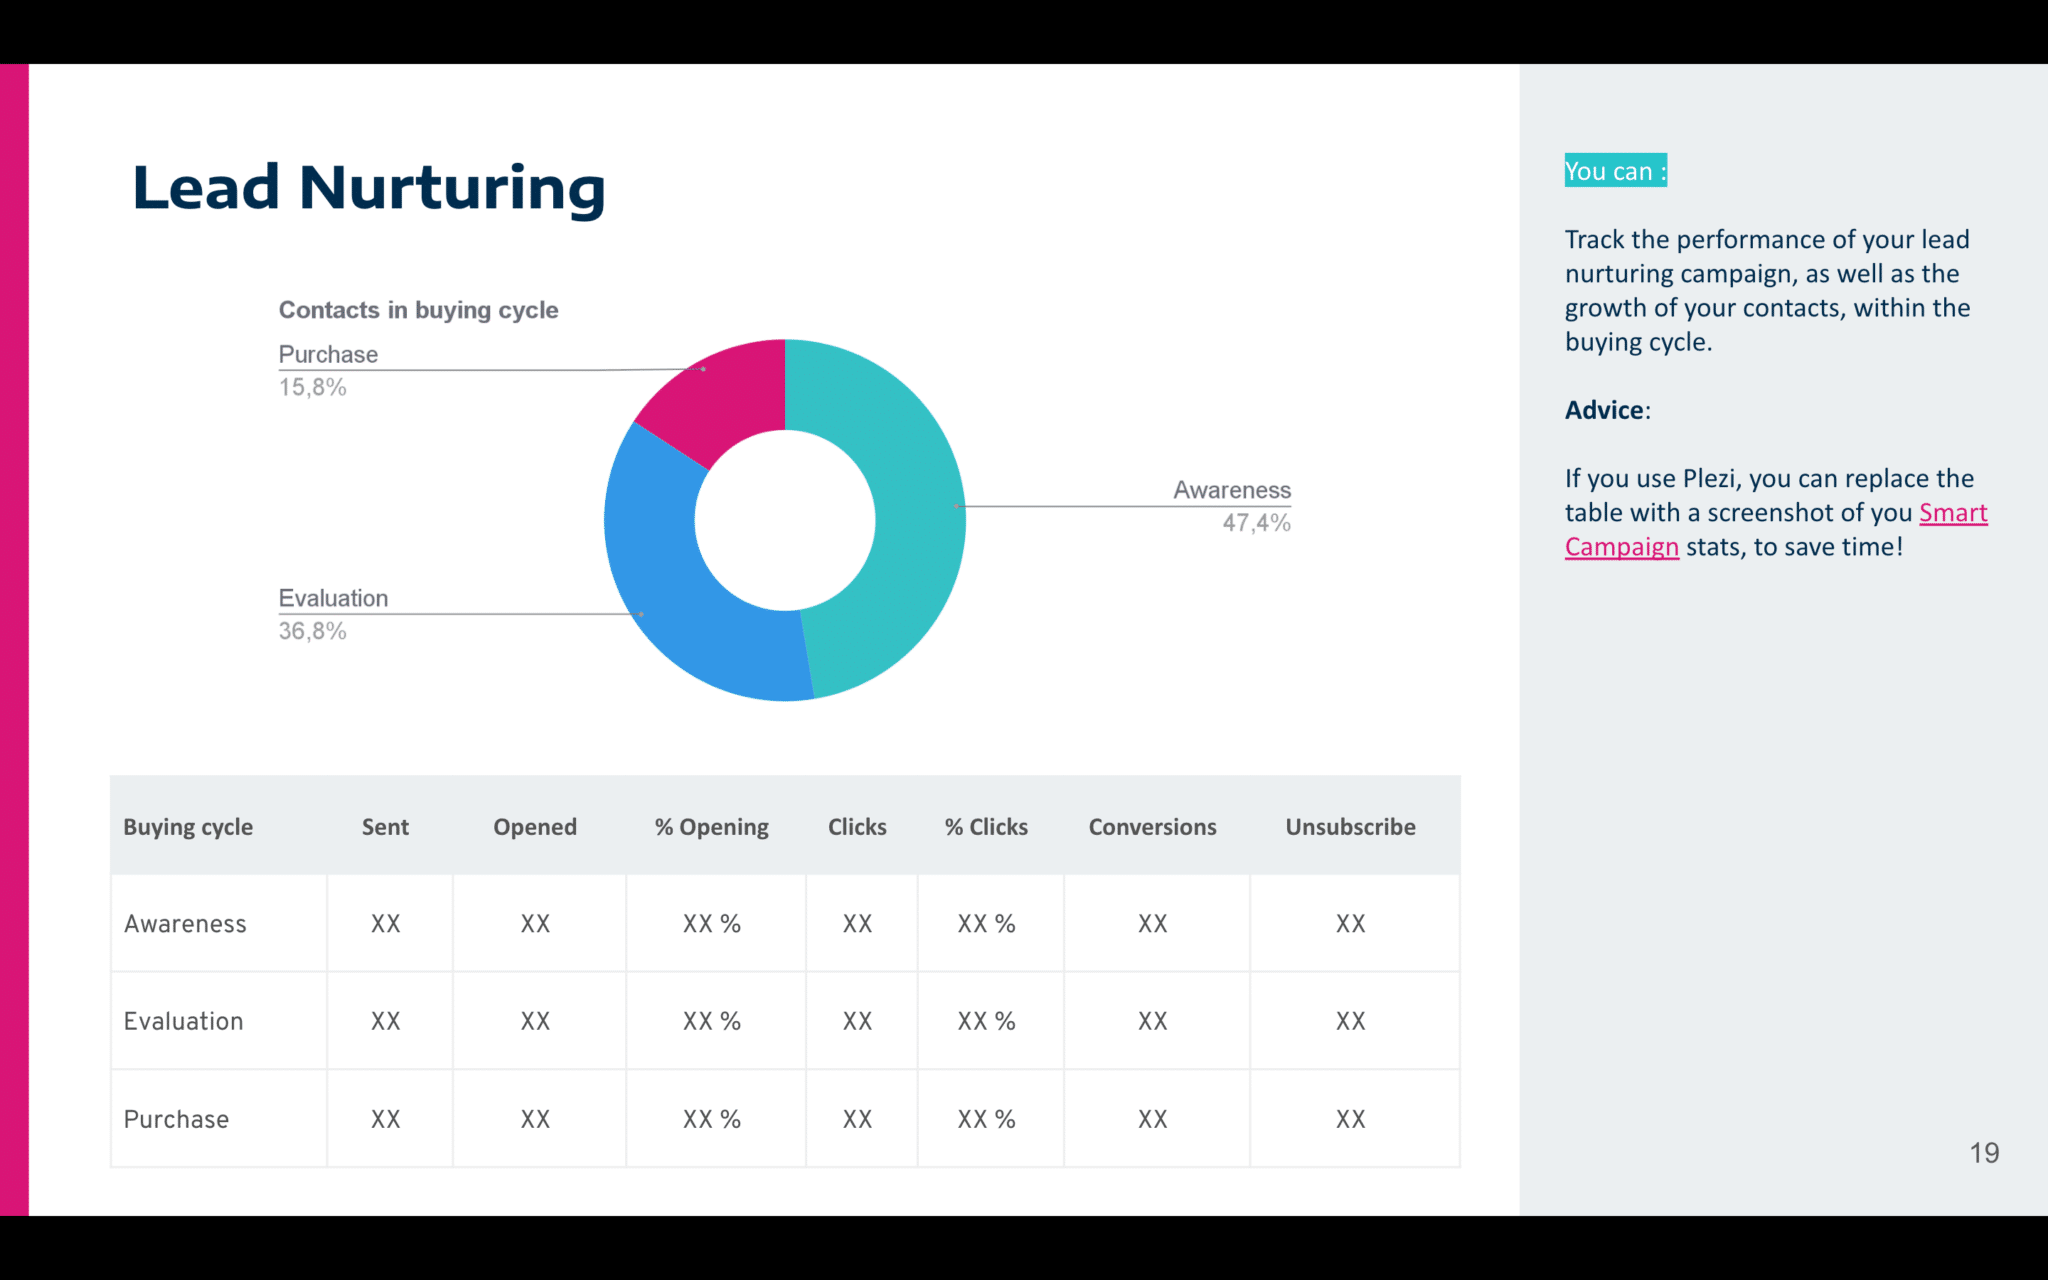
Performance of your lead nurturing programme
More than any other marketing strategy, lead nurturing will let you build a real relationship with your leads. It’s vital, therefore, to monitor the performance of your lead nurturing programme. This will give you a clear picture of changes to your contact database over the three stages of the buying cycle: awareness, consideration, purchase.
At Plezi, our Smart Campaign feature lets us automate the lead nurturing process in a highly personalized way for each lead, saving us valuable time.
This provides you with a detailed dashboard that lets you track key campaign statistics. When producing a marketing report, the contents of this slide can be replaced with a screenshot of these statistics from the Smart Campaign dashboard.
4.6. Social media
How effectively have you used social media?
This slide looks at both how well a company has performed on different social media and the performance of content posted on these channels.
Social media can attract significant amounts of traffic to your website, and users of different social networks could very well become customers. A social media presence can greatly increase the visibility of your content online and improve brand awareness. It can also have a role to play in your overall marketing plan.
For all the above reasons, you should include social media performance in your marketing report. To help measure your performance on different social networks, it’s a good idea to include an overall performance slide that gives you an overview of your performance on social media. You can then add a slide for each social network that you use that includes the relevant metrics.
4.7. Advertising
What has been the impact of your advertising campaigns?
Whether this involves sponsored ad campaigns on social media, a PPC campaign, or an email marketing campaign, you need to track this data and show in your report what worked or what didn’t.
Your audience will be very interested in this vital information, so it’s a good idea to make use of visual elements when presenting it to make it easier to understand. This should show not only whether campaigns have worked, but also how much money was spent on these and what the return on investment was. This information can then be used to plan future campaigns. Here, you mostly want to talk about budget and ROI.
In the template, we’ve also included a general slide that gives an overview of your advertising channels and detailing the number of leads, customers, and return on investment for each channel. This lets your audience quickly see which channels are the most profitable.
Then, as for social media, you can present the KPIs for each channel on a separate page, enabling you to go into more detail about each one (e.g. Google Ads, Facebook Ads, LinkedIn Ads).
4.8. Recommendations
What conclusions can be drawn from this marketing report?
This section can be divided into two parts:
- Your lessons learned and general observations. For example, what worked, what didn’t work, where is there room for improvement, what needs to be dropped.
- Your own action plan and initiatives to improve marketing performance in the next period. This will enable you to communicate to your executive team what actions you plan to take and ideas that you would like to implement. Doing so will show that you are taking a proactive approach.
5. How to save time in the reporting process by using marketing automation
If you haven’t already done so, why not download a copy of our marketing report template?
 Having to update and present marketing reports on a regular basis can involve a huge amount of work. Given the number of KPIs that you’re now required to measure, it’s now very difficult to prepare a marketing report without the help of automation.
Marketing automation software like Plezi gives you direct access to your reports on a single platform and in real-time. It also makes it easy to export and assess data. To find out more about our marketing automation platform, why not request a free product demonstration?