For your digital marketing strategy to be successful, you need to be able to gather data and information about it. It should also be based on clear and measurable objectives. This means you need to be sure that you are measuring the right digital marketing key performance indicators (KPIs) at each stage of your conversion funnel.
In this post, we’ll look at:
- What KPIs are
- How to use KPIs
- KPIs you need to track for digital marketing

What are KPIs
KPIs are quantifiable metrics that can be measured over time, and which enable you to make informed strategic decisions. They help you better understand how visitors behave on your website. They are literally key to being able to define your B2B digital marketing objectives (because a SMART goal is always measurable!), and it’s vital that you chose them carefully.
The current generation of analytics tools can measure just about anything. To help you decide which KPIs you should be measuring, we’ve selected what we think are the essential inbound marketing KPIs for each of the main areas of marketing activity.
How to use KPIs
To successfully manage your inbound marketing strategy, you also need to know how to use the figures that you have in front of you.
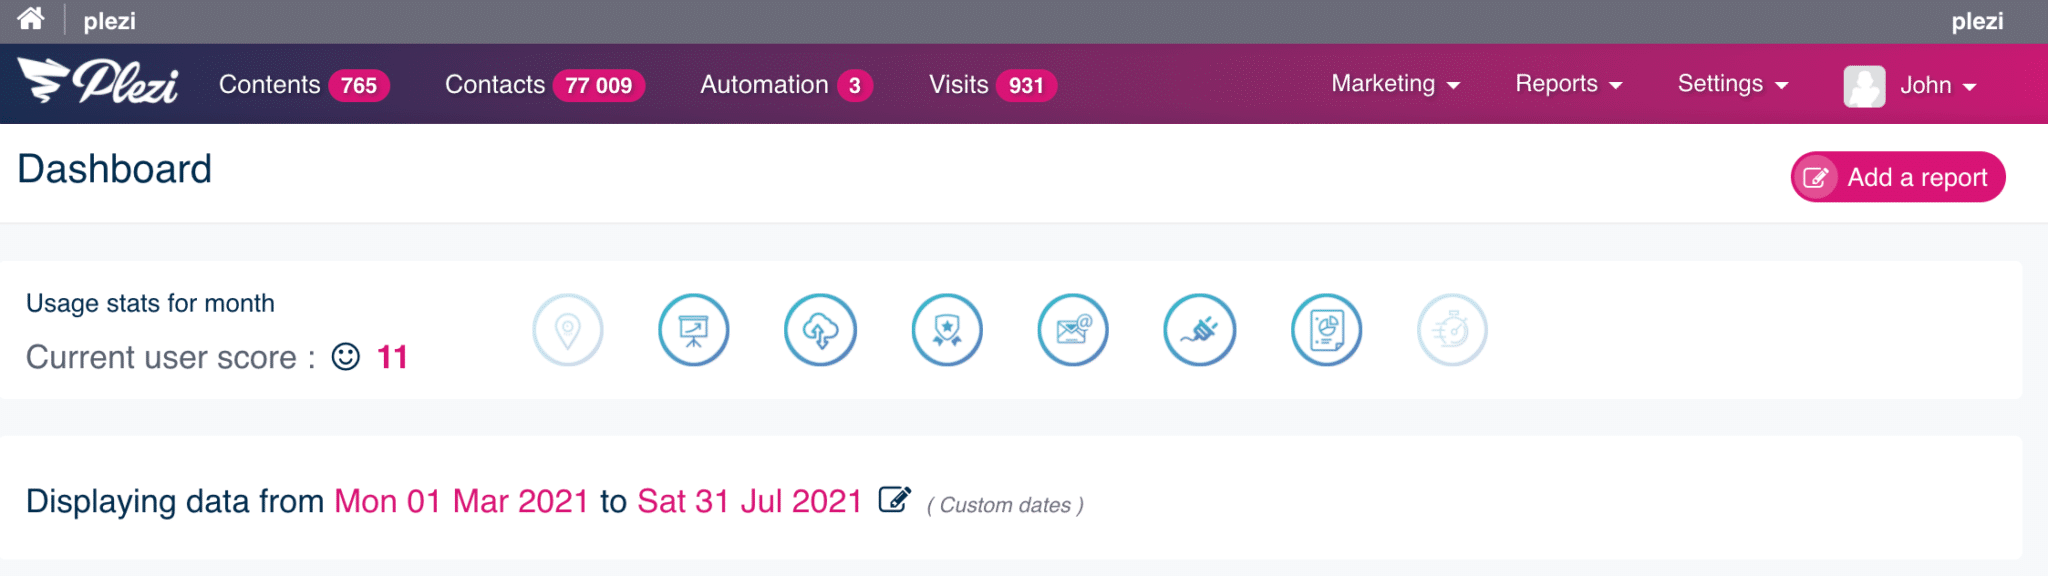
And to really drive business performance, you need to have your KPIs together in one place.
Some platforms, like Google Analytics, let you track some of the KPIs you need, mainly related to your website audience and search engine ranking.
A better solution is to use a marketing automation tool. The reporting features of these tools make it easy to monitor your whole performance at a glance, including content, banners, click-through rate, social media advertising, and much more.
Integrating this with the other tools you use to manage your business will give you a comprehensive overview of your entire inbound marketing strategy.
![]()
Whichever platform you choose, it’s a good idea to:
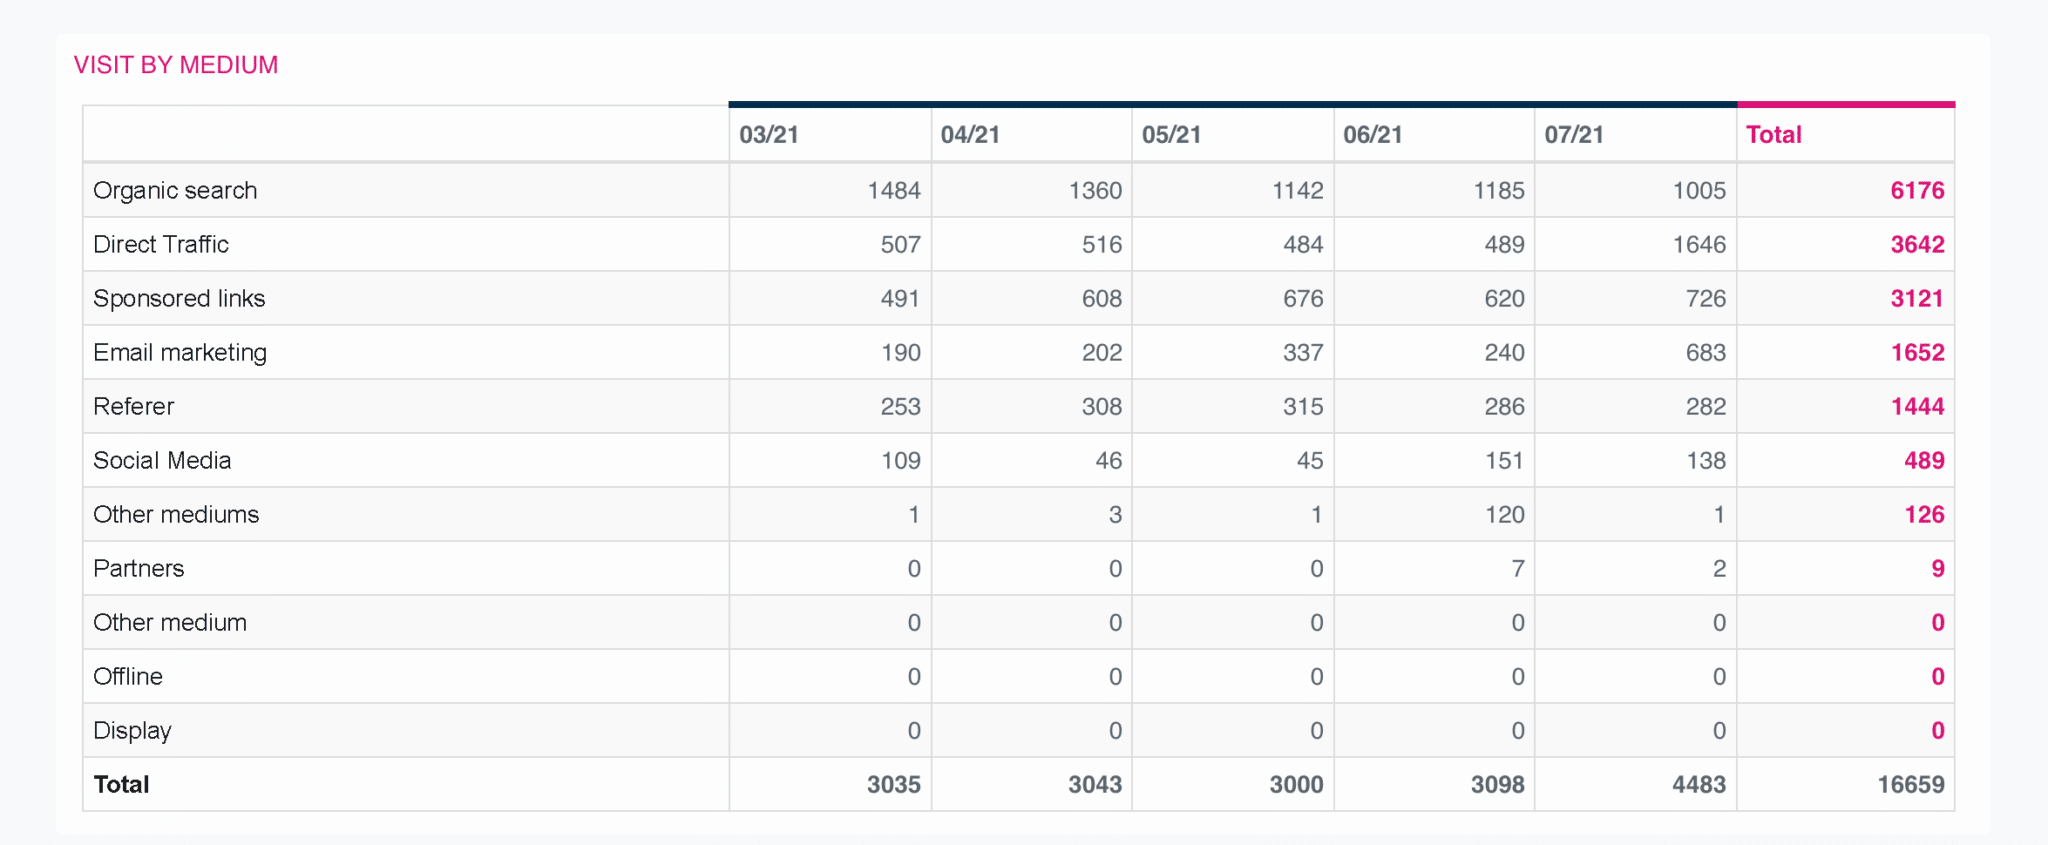
- Compare KPIs over time.
The numbers of visitors to your website, for example, will vary. Rather than looking at isolated figures at specific times, calculating an average value will let you know if overall numbers are trending up or down. Figures by themselves don’t really mean anything; it’s how they change over time that counts. - Decide on your “must have” KPIs.
These are the most important KPIs for your business and vital to measuring performance. They can be whatever you decide. For example, organic search results, or the number of new customers. Just make sure that you monitor them closely and that what you are measuring are not simply vanity metrics. - Set objectives
The best way to improve the performance of your website is to set targets for each of your KPIs. Having quantifiable objectives will give you much better control of your digital marketing strategy.
The KPIs you need to track for digital marketing
1. Website KPI’s
Website traffic, its source, and behaviour
The first stage of any inbound marketing strategy involves generating traffic to your website.
To do so, you’ve created content and used different techniques like SEO to make it more visible online. So, to make sure everything is working as it should be, the first metric to track is the number of visits to your website.
You should see a steady rise in this figure as you create more quality content. However, by itself, this KPI won’t provide you with any actionable information.
To ensure content is shared online as widely as possible, you need to know how visitors have arrived on your website. You also need to be able to break down your website traffic by different acquisition channels:
- direct (traffic coming directly to your website without previously visiting another website)
- organic (traffic coming to your website following a search query)
- social (traffic from social networks)
- referral (traffic from your existing clients, or because of a recommendation)
Monitoring how traffic changes for each of these sources will help you implement new strategies for traffic acquisition or adjust existing ones:
- Not enough social media traffic? Consider implementing a dedicated social media strategy.
- Is your organic traffic lower than it should be? You might need to rethink your content strategy and optimize content for SEO.
- Too much direct traffic? That should be setting off alarm bells! Are you using your UTM parameters correctly?
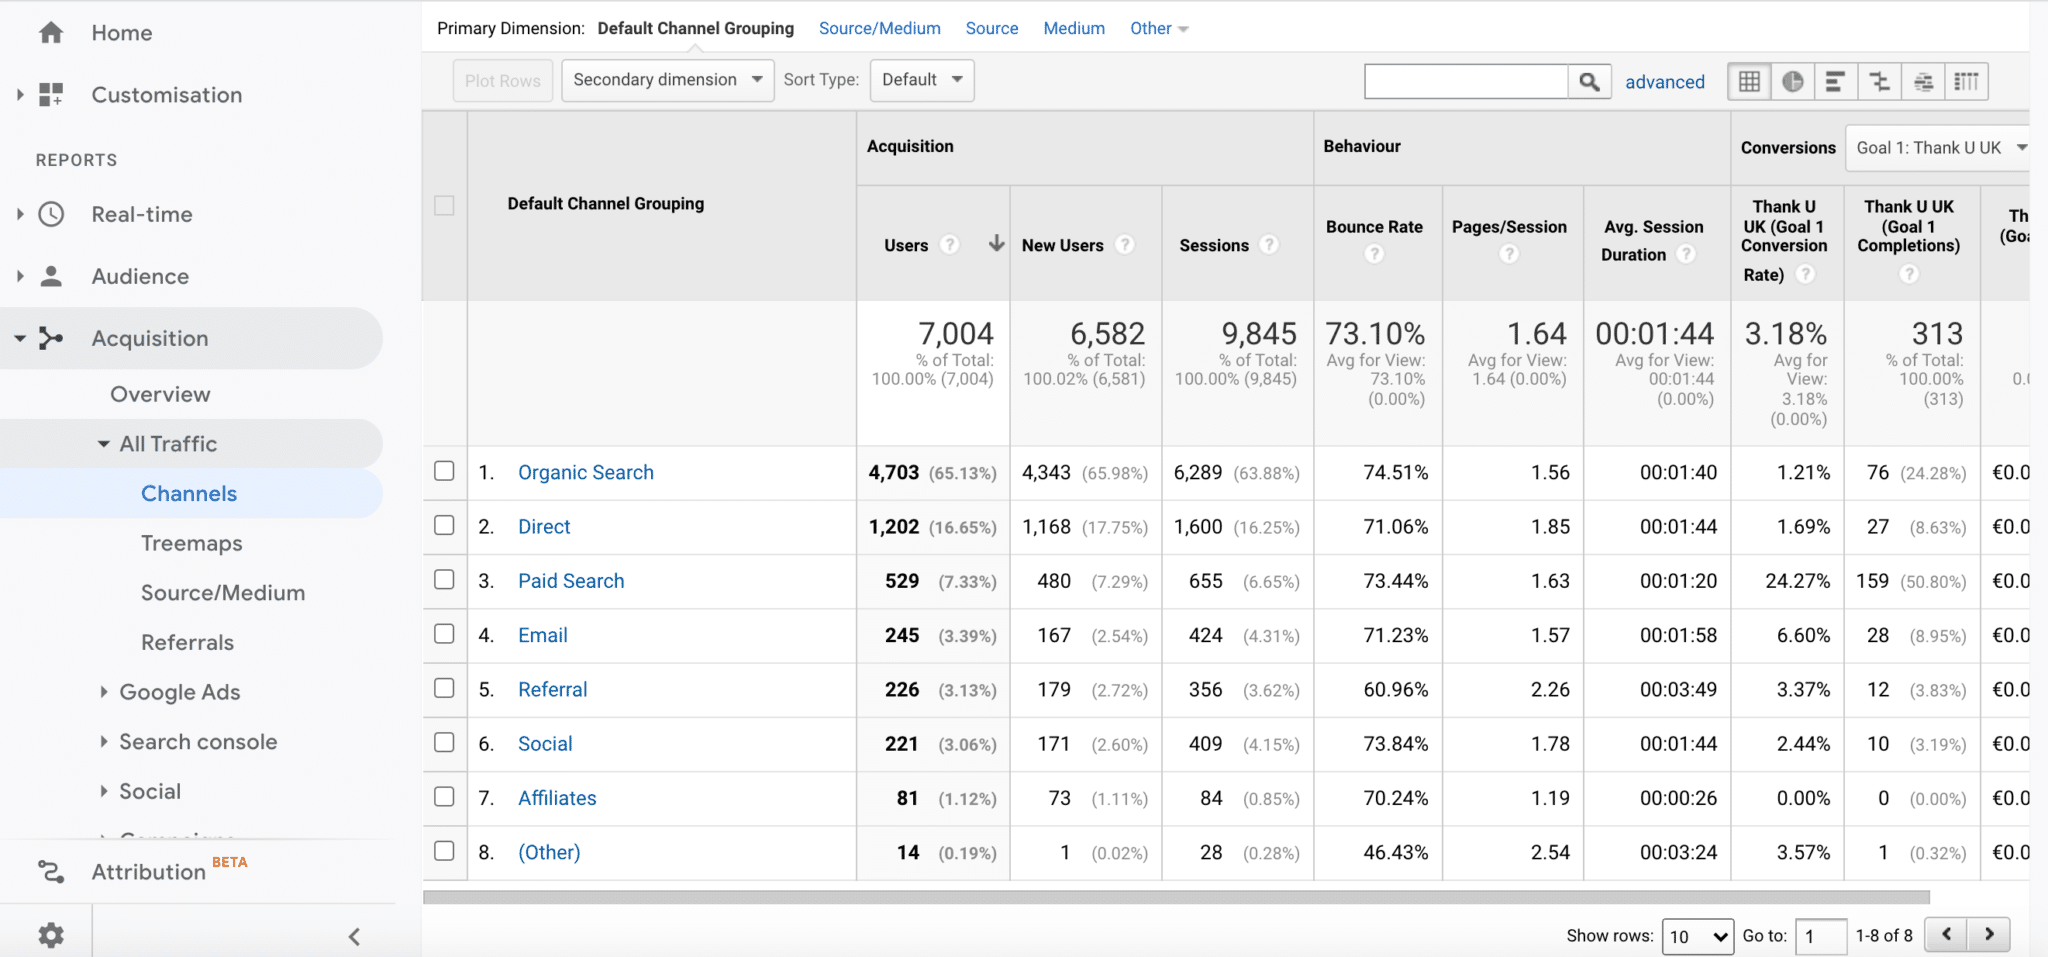
You also need to find out more about your visitors and their behaviour. Where do they come from? What are they looking for? Which web pages do they look at first? What path do they take to get to you (e.g., via a referrer, Google search, Google Ads)?
Use Google analytics and your B2B marketing automation software to analyse the statistics of your website or blog and identify:
- the number of monthly visits
- how this compares with traffic for the previous month or year
- the number of unique visitors
- the average number of pages viewed
- the average visit time
- the bounce rate
- the number of return visitors
- the number of new visitors
- traffic acquisition channels (SEO or SEA)
- the device used (e.g., desktop, smartphone, tablet)
How to track these KPIs
Google Analytics is a good first source of information about website traffic and conversion rates:
Marketing automation software can also give you access to this information and let you monitor these metrics. At Plezi, we use… Plezi of course! 😉
For more information, you can also track:
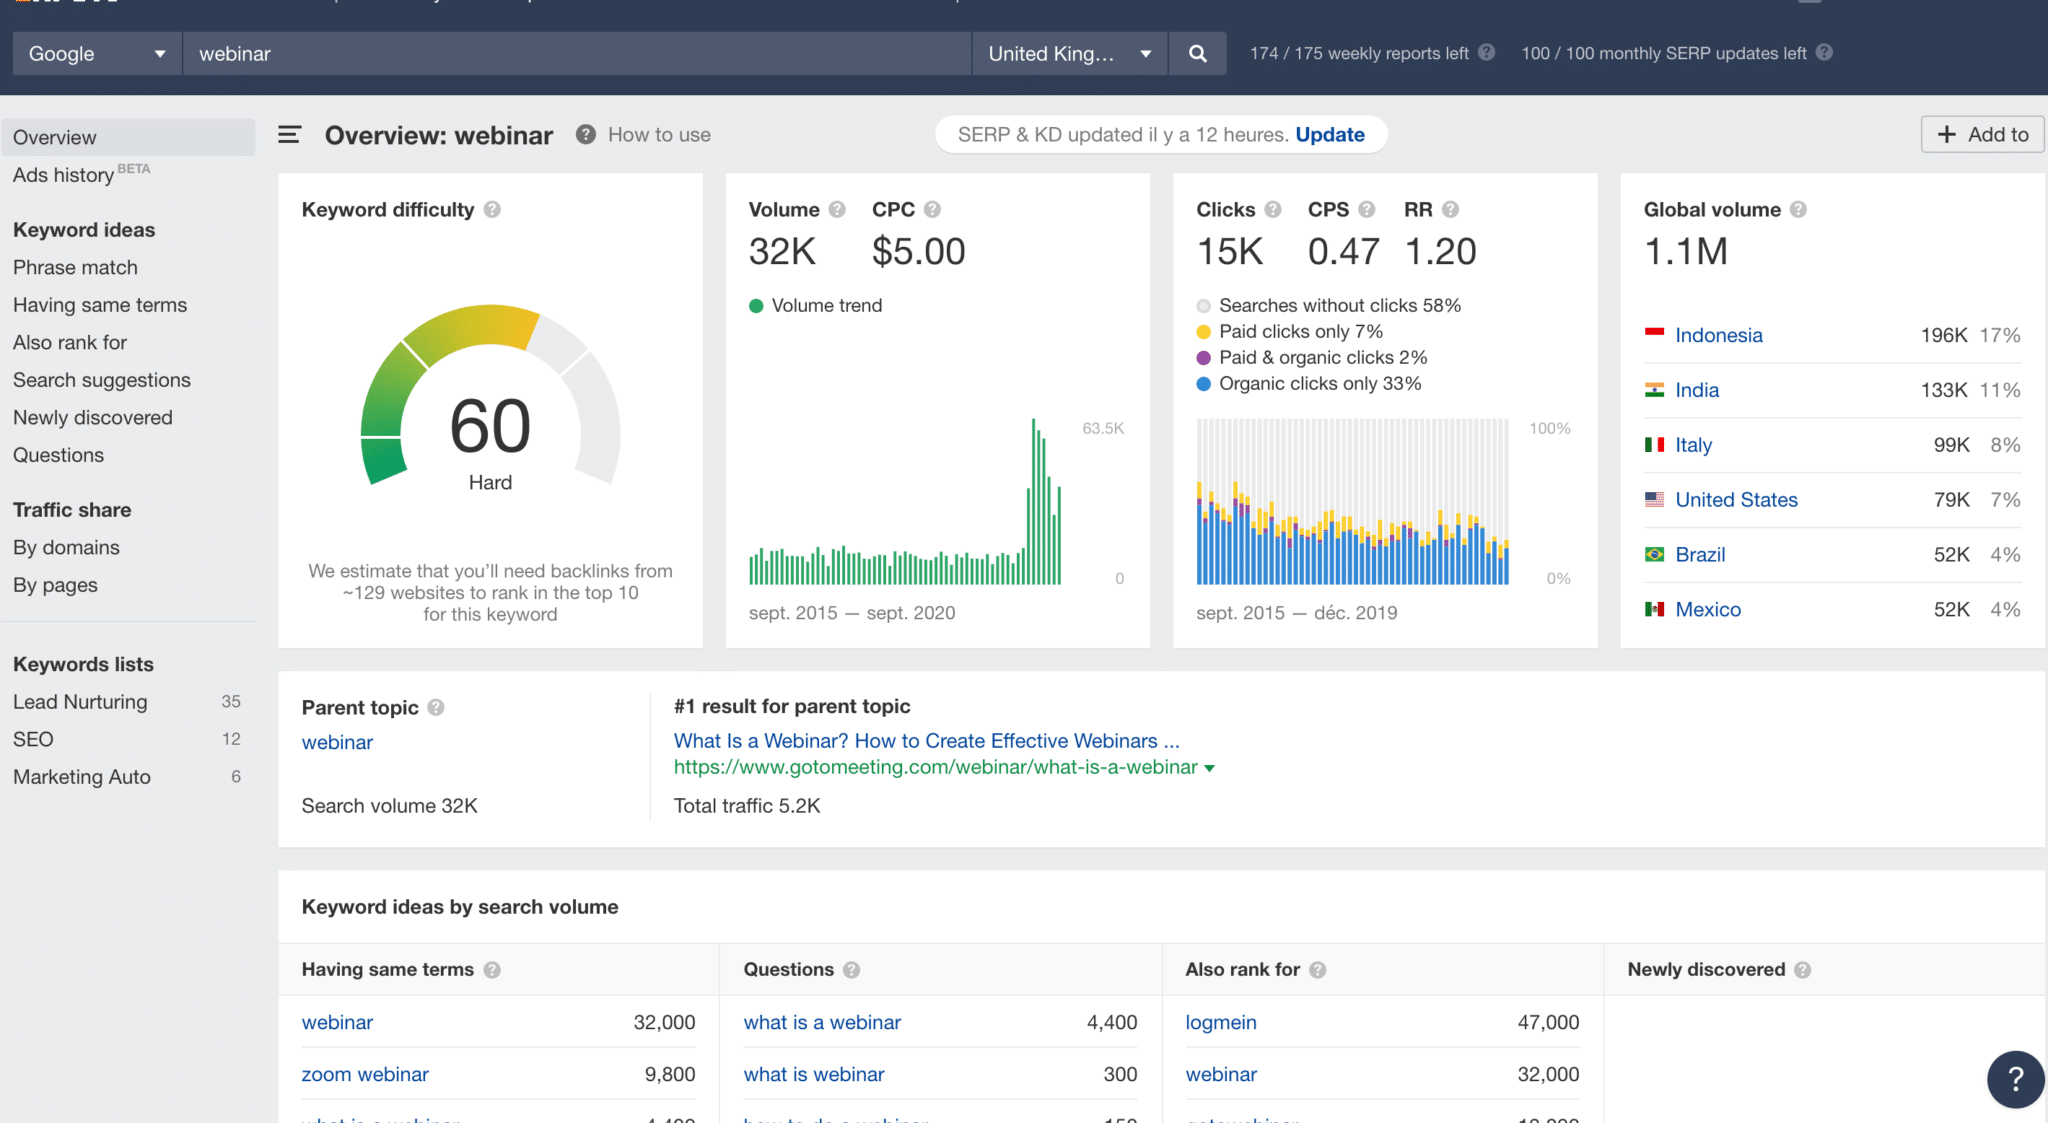
- How you rank for different keywords, both in your content and across your entire website. Measuring the SEO performance of your website with Google Analytics, or Ahrefs for example, will let you adjust your content marketing strategy accordingly and increase the visibility of your content to leads and customers.
Landing page performance
The conversion rate of your landing pages is one of the most important metrics you have.
To find out what this is, calculate the number of visitors to the page who have taken the desired action as a result (e.g., filled out a form, subscribed to an offer, requested a product demo, or downloaded a white paper). If this figure is where you want it to be, great. If not, use A/B testing to help you increase the effectiveness of your landing pages. This will help you check:
- that your message is clear and concise
- that the page layout is simple and appealing
- that the fields of your contact form are all relevant
- how persuasive your call to action (CTA) is
Want to create effective landing pages that are guaranteed to convert visitors? Get our checklist on how to create a perfect landing page.
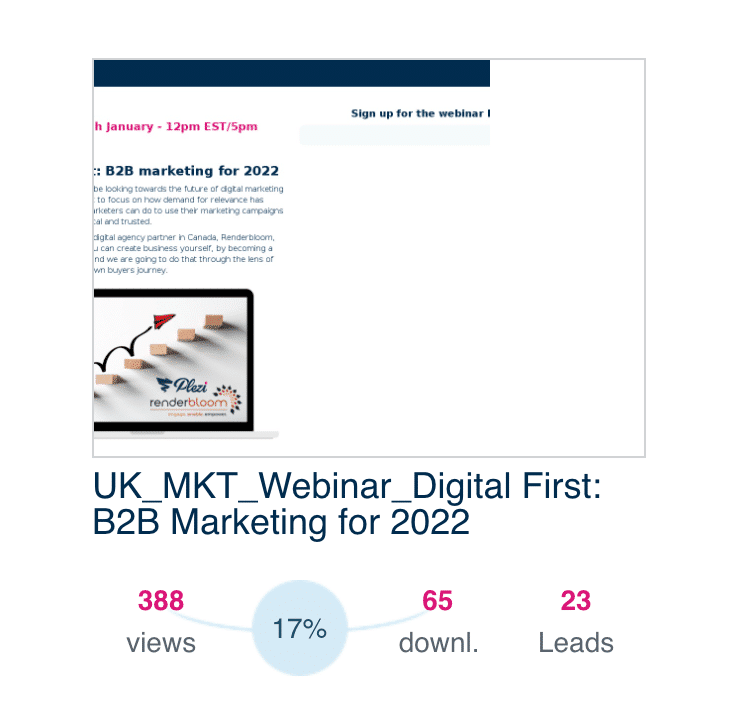
(Conversion rate for our webinar – Digital First in Plezi)
There are a number of ways to boost your conversion rates that are specific to each stage of the marketing funnel. You can choose which ones to use based on what will work best for your business sector.
2. Email marketing KPIs
Email marketing is vital to helping you both retain and convert B2B customers and prospects. It lets you stay in touch and create a relationship with them, as well as build trust and brand awareness. You can create email marketing campaigns based on things like buyer behaviour, demographics, or according to what stage in the sales funnel your leads are in.
Email marketing is also a great tool to nurture leads. It lets you send emails to leads to encourage them to take further action and move further in the funnel.
But just like the content you create, the emails you send must be designed to convert. If you don’t correctly segment your mailing list, or if your email subject lines aren’t very catchy, this can result in low open rates. Low-quality content, CTAs that are not visible, or not having CTAs at all can also mean your emails have a low click rate.
After each series of emails, analyse the following KPIs to help improve future campaigns:
Delivery rate
This is the number of people who have received your email in their inbox. Having a lot of subscribers is good, but the quality of these contacts needs to be as high as possible. You will improve the delivery rate of emails and the performance of your campaigns as a result. Monitoring this KPI lets you identify those contacts with invalid or deactivated email addresses. If your delivery rate is too low, it’s probably time to clean your contact database!
Open rate
This is the number of people who have both received your email and opened it. This KPI is crucial for understanding the different things that can affect email performance. For example, email frequency and timing, and how appealing your email subject line and sender name are.
Click rate
This is the number of people who have opened your email and clicked on a link. It’s a great KPI for understanding how well email content performs.
Conversion rate
This is the number of people who have taken the desired action as a result of your email (e.g., requested a product demo, downloaded content, registered for an event). If this figure is too low, the problem might lie with your message, your CTAs, or your landing page.
Unsubscribe rate
This is the number of people who have received your email and chosen to unsubscribe from further emails. If this figure is too high, you need to rethink the content of your emails or how often you send them.
How to track email performance
You can use a dedicated email marketing tool to do this. But you can also use marketing automation software. We can easily monitor all these figures in Plezi!
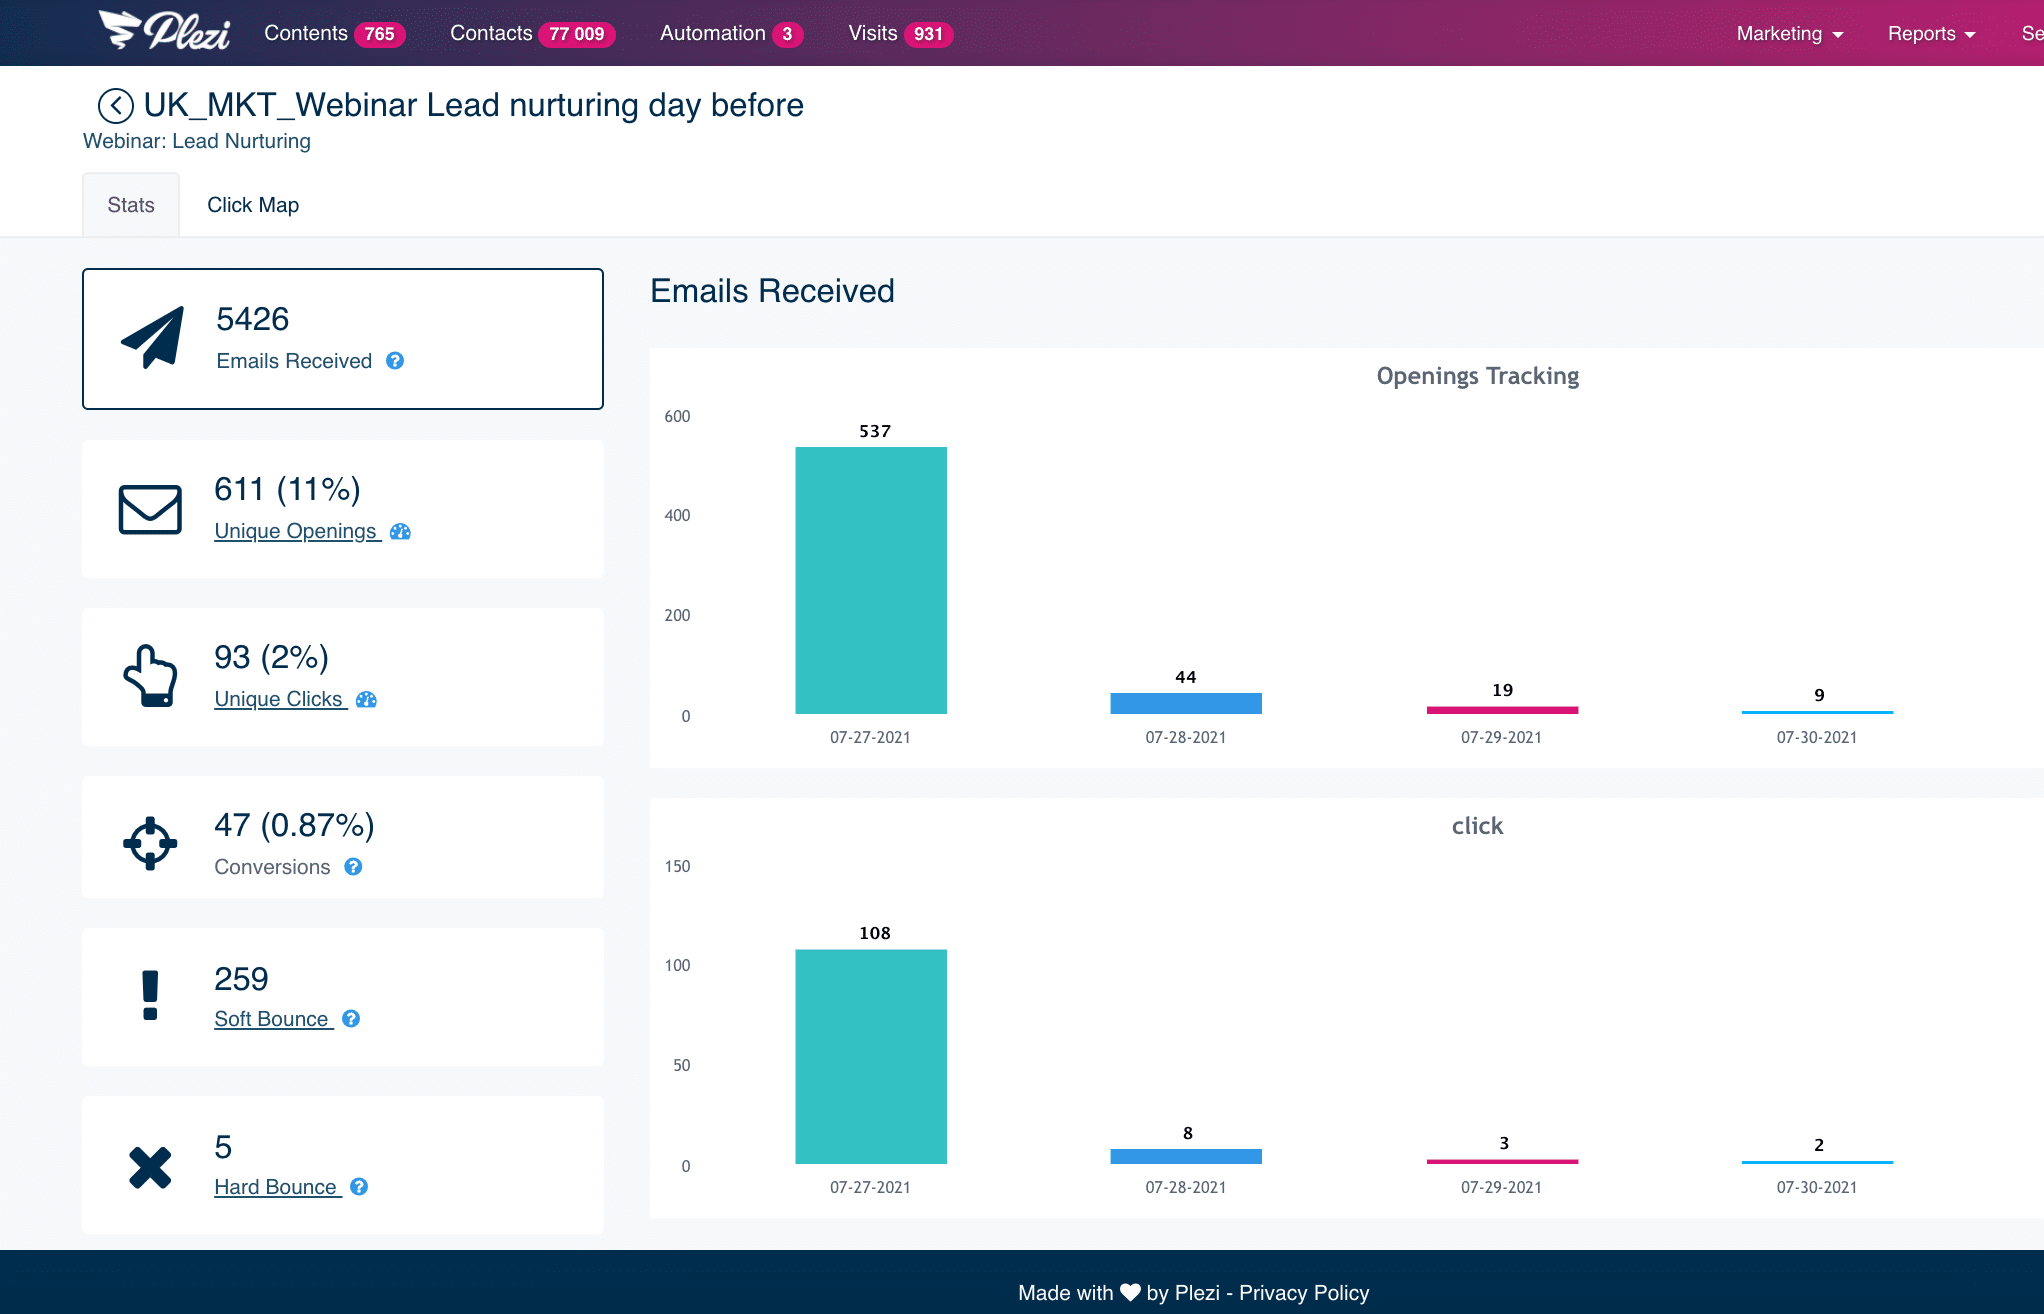
(Open and click rates for an email from Plezi)
Feel a bit lost trying to decipher yet another study on B2B emailing marketing statistics? Look no further! We’ve summarized the results of four major studies for B2B so you can see exactly where your email marketing campaigns need to be.
3. Social media engagement KPIs
You should start by setting some goals for your communication or marketing strategy on B2B social media (e.g., LinkedIn, Google +, Twitter, and to a lesser extent Facebook). Would you like to drive traffic to your website and blog? Make direct sales? Collect email addresses? Increase signups for your next webinar? The goals you set will help you define the KPIs to measure.
Engagement rate
The number of followers or fans your B2B social media account has is not the most important thing to measure. This is a vanity metric that might be good for your ego, but which might not have a great effect on sales. The most important KPI on social media is engagement. This is the number of likes, comments, shares, or retweets that your posts get on these platforms. The engagement rate is the number of people in your community who react to content you post.
Social media traffic and leads
Using a B2B digital marketing tool will let you easily track the performance of links you share. This will give you information about what content and formats appeal to your target audience and let you track leads generated on social networks.
All this information can then be used to assess how well you can reach your target audience on social media and engage your community. It’s important to note that social media engagement is also taken into account by Google when ranking your content.
4. Link building KPIs
Links between web pages are one of the things Google uses to rank websites in its search engine. That’s why it’s important to make them part of your SEO strategy. If your website receives a backlink from another website dealing with the same topic, this is seen by Google as a positive signal.
The more backlinks like this you receive, the higher your ranking in search results. But be careful, not all links are worth having. Those that come from dubious websites or websites too far removed from your areas of expertise can be interpreted by Google as an attempt to manipulate its algorithm.
5. Acquisition and lead generation KPIs
Number of MQLs sent to sales
The number of qualified leads that you pass on to the sales team remains THE figure that you should always be thinking about.
To help put it in context and make better use of it, you can also monitor the conversion rate at each stage of your marketing funnel: from visitor to lead, from lead to MQL, from MQL to SQL, from SQL to customer.
To do this, follow these steps:
- monitor the number of leads and MQLs (marketing qualified leads) for an overall view of how effective your marketing strategy is;
- also monitor the number of SQLs (sales qualified leads or opportunities created) and the number customers generated over the same period, while being mindful of your sales cycle;
- use these figures to work out percentages: How many visitors turn into leads? How many MQLs turn into customers?
- then calculate your conversion rate at each stage of the funnel. For example, to find out how many leads are converted into MQLs, perform the following calculation: number of MQLs / number of leads.
This “super metric” should quickly become a guide for your whole team!
It’s vital to your inbound marketing strategy because it indicates how well you can move leads through the purchase funnel. You should also continuously optimize your content, calls to action, and landing pages so your conversion rate continues to increase month after month.
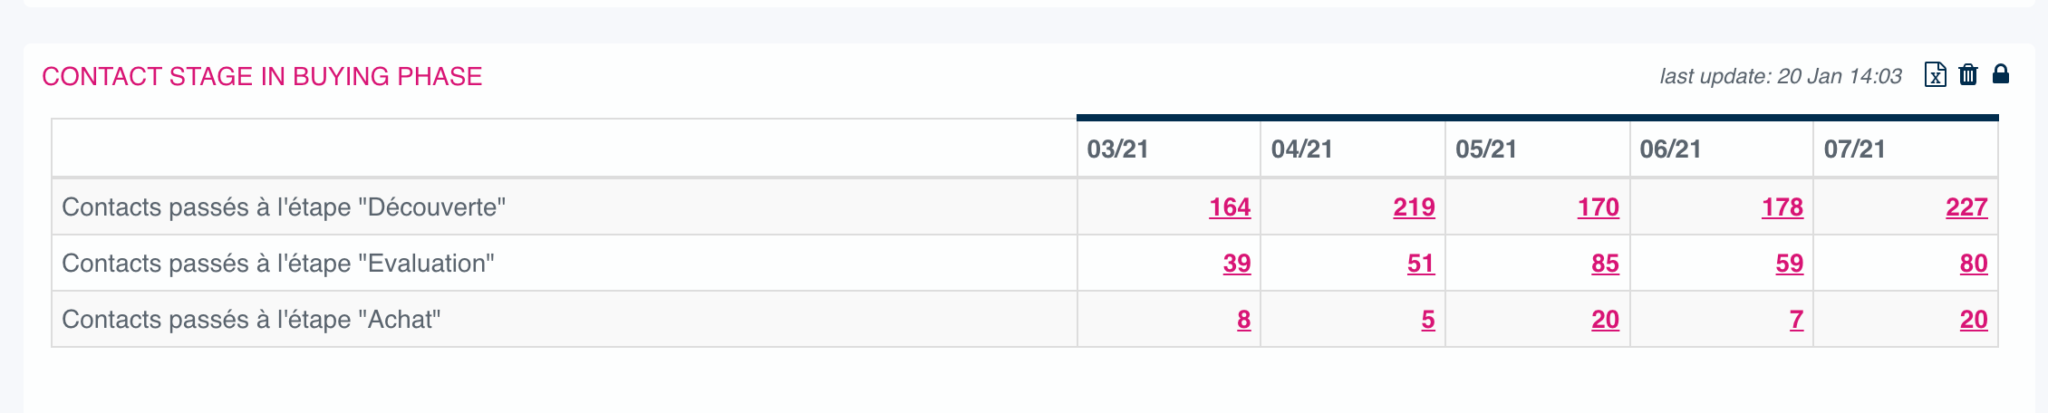
We use Plezi to track the entire buyer’s journey of our MQLs. Ask your sales team to give you figures for SQLs or find these metrics in your CRM.
Cost per lead
Knowing the cost of acquiring leads is an extremely important KPI. It will help determine the best acquisition channels and marketing actions to use (e.g., SEO, SEA, social networks, webinars, trade fairs, workshops).
To calculate this, divide the total cost of your B2B inbound marketing campaign by the number of qualified leads generated over the same period. Don’t forget to include peripheral costs (e.g., employees’ wages, software subscriptions). This KPI will help you forecast the budgets your campaigns need to achieve the goals you have set.
6. Return on investment KPIs
It’s finally time to answer the big question: how cost-effective is your B2B digital marketing strategy for your business?
Customers generated by marketing
If you carefully track the numbers of MQLs and SQLs you generate, then you won’t have any trouble calculating how many leads are converted into customers. You can do this using your CRM or your marketing automation tool.
In addition to knowing the number of customers, you’ll also want to know the sales revenue generated. Depending on how your business operates, this might represent the total value of a contract or recurring monthly income (MRR).
Customer acquisition cost (CAC)
Now that you know the number of customers generated by marketing, you can calculate your CAC (Customer Acquisition Cost).
This figure represents the average amount spent by your business to generate a customer. To calculate it, divide the total amount invested in marketing by the number of customers acquired over a given period.
For more information about the customer acquisition cost and how to reduce it, read our dedicated blog post.
Monitoring this KPI is essential if you want to ensure that your customers don’t cost you more than their value to your business. To complete your analysis, you can also measure your customer lifetime value (CLV).
Return On Investment (ROI)
Armed with figures for the sales revenue generated by marketing as well as your marketing expenses, you can now calculate the return on investment of marketing.
The calculation is simple: (profit – investment) / investment = ROI
For each pound invested in marketing, you’ll be able to show how much your company gets back. You can also perform this calculation for each marketing channel. This will let you identify those that deliver the best results and conversely, those whose results leave something to be desired.
You can track almost any KPI you want on your website if you spend a bit of time doing so. But to really see any benefit, you need to choose KPIs that are truly useful to your business and use them in a targeted way.
Calculating KPIs to have a snapshot of your business at a given moment in time is of limited value. It’s best to track how KPIs change over time and to evaluate these in the context of marketing actions carried out during the same period. And if you need help tracking your sales and marketing goals, check out our dedicated kit below: